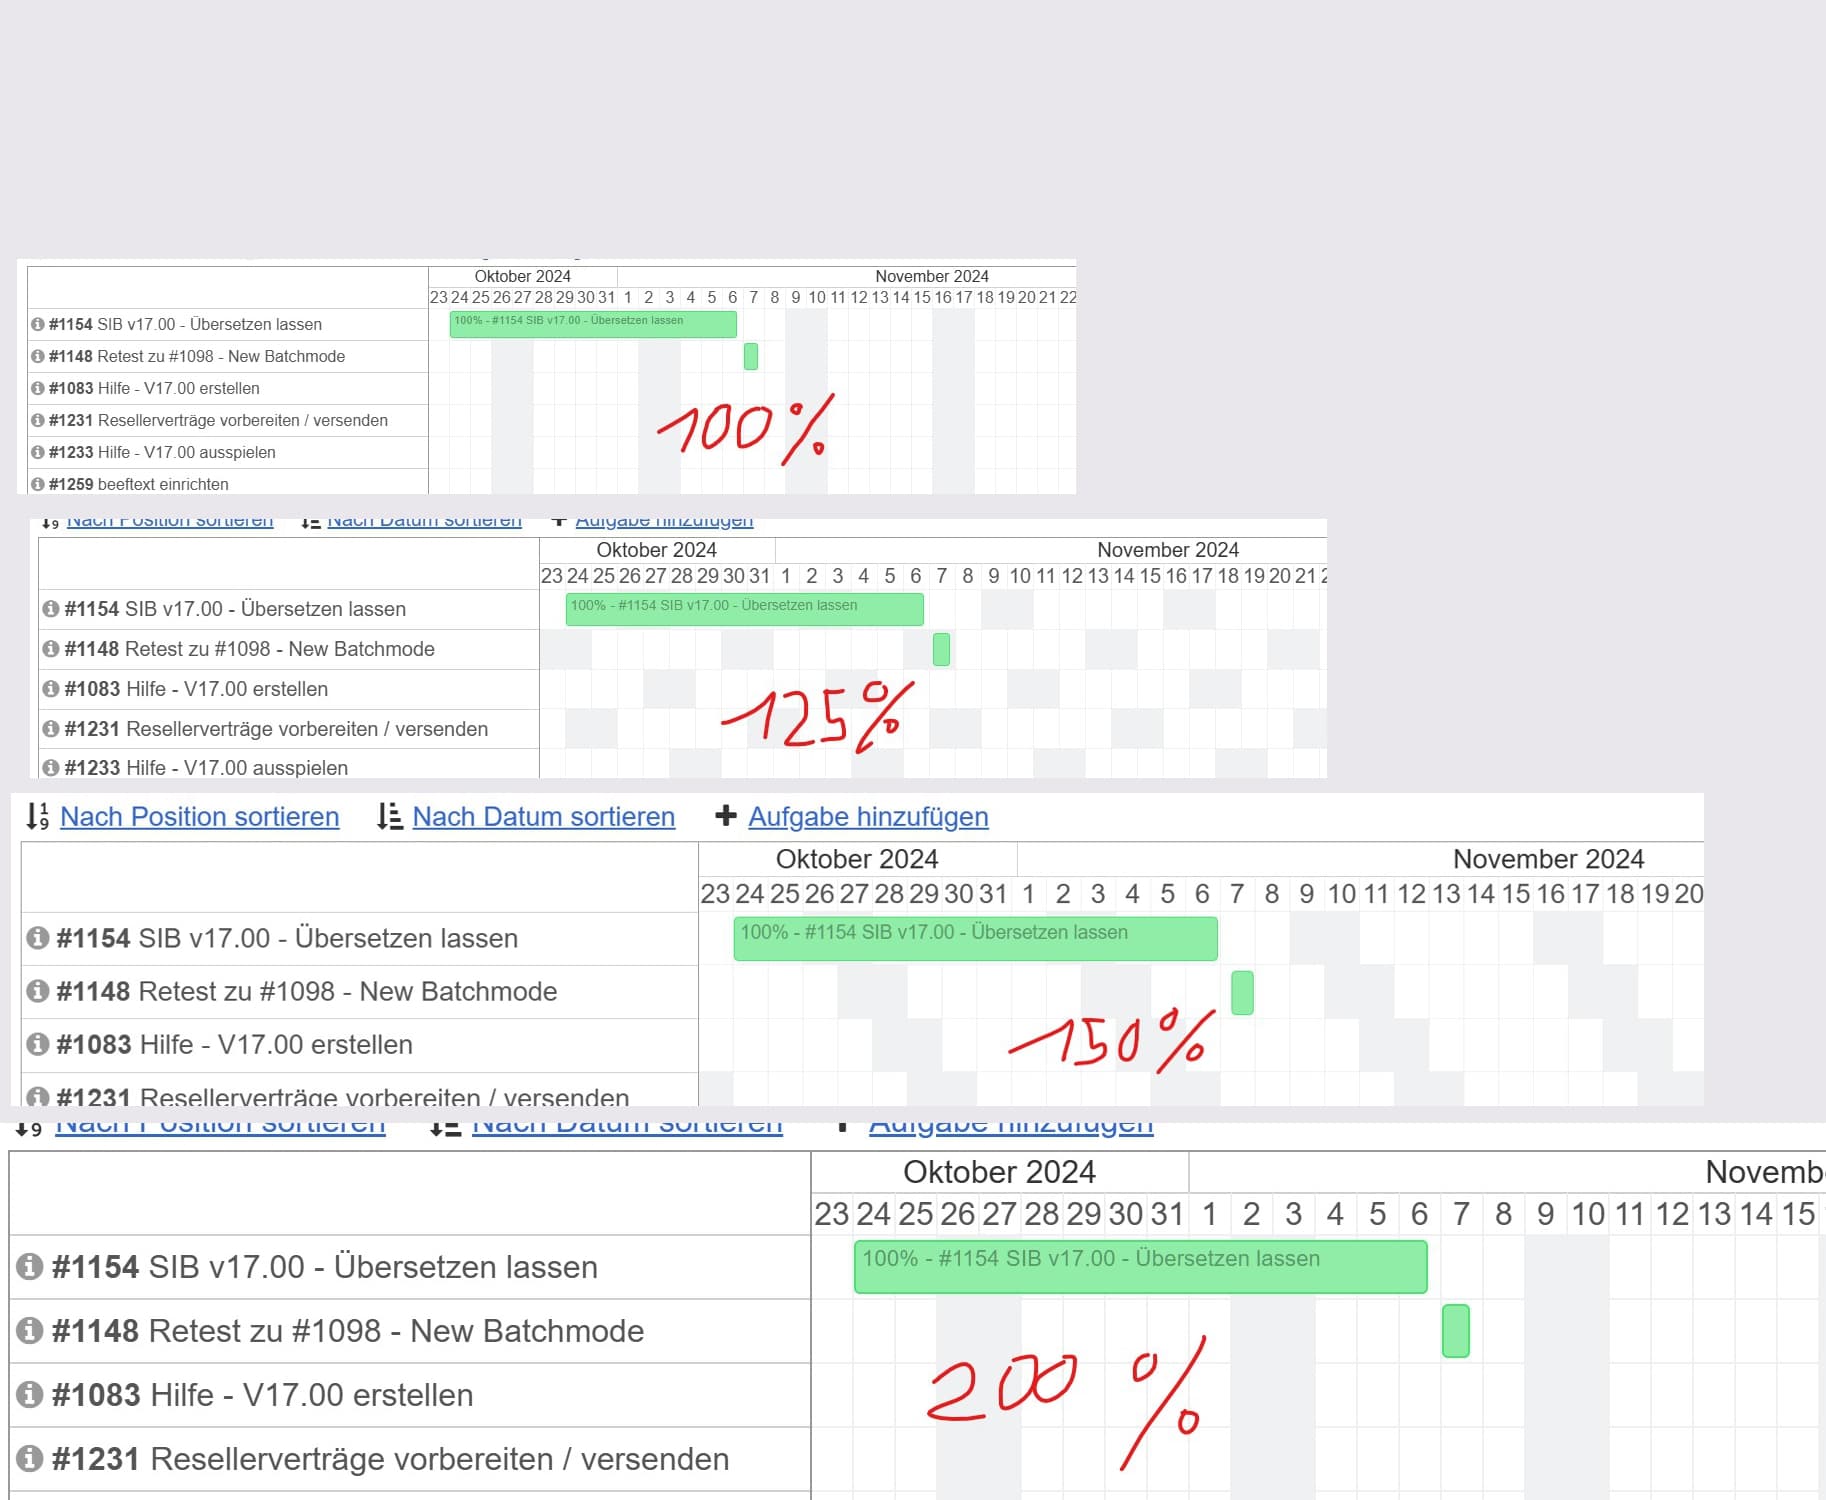
The Gantt chart only works with a 100% zoom or multiples thereof. If you increase the Windows display zoom or the browser zoom to, for example, 150%, the blocks in the chart shift and you can no longer operate the chart. At 200%, everything works fine again. However, on a 4K monitor, you rarely set 100% or 200%; instead, you usually use the recommended 150%.
Hi Rainer, thank you for your feedback
yes, I can operate/drag the beginning and end of a task but how can I be shure about start and end date because not the grid colors are jumbled but the grid itself so that there are line breaks, empty areas = the grid not fitting the start and end dates. I think there might be a problem with the calculation of the month/day ruler top of the grid. I tried some things in the code but without success.
I do not use Gantt, so I do not have any experience or much knowledge. S I need a complete step-by-step instruction how to reproduce your observations and a hint what is unexpected for you.
My latest observations:
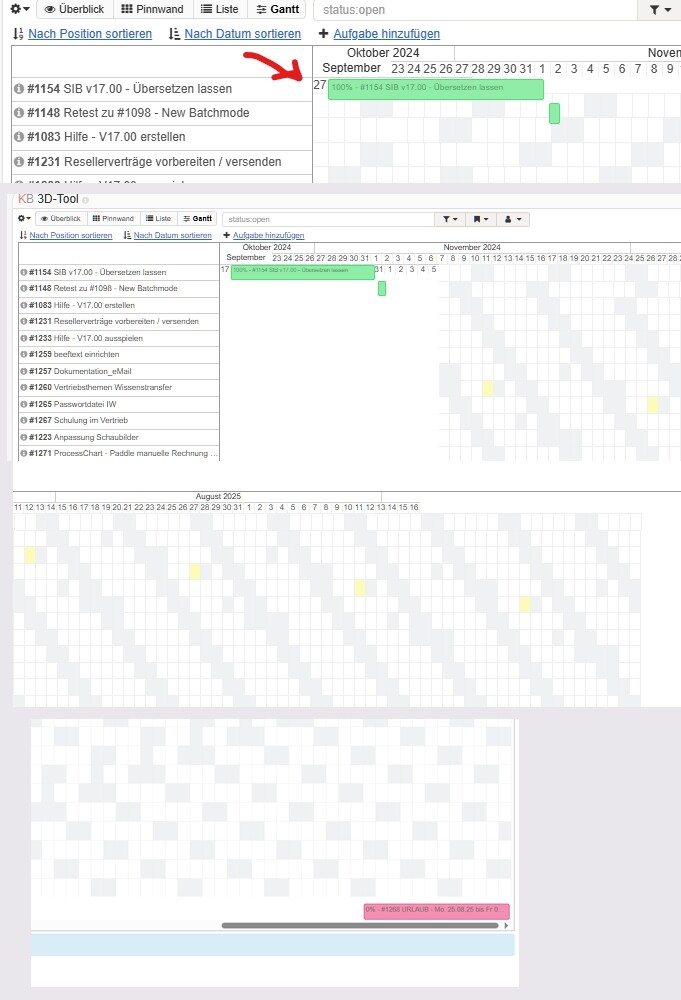
a) I can NOT confirm effect in your second screenshot “grid disappears”
b) I can NOT confirm effect in your first and second screenshot that Month Name covets Date Day Numbers
c) I can’t imagine what the “27” right from the red arrow in your first screenshot might mean.
d) I can’t imagine what third and fourth screenshot should tell
e) I observe that takeover of modified start and due dates form Gantt Chart to Task view is not reliable. Seems that it does not matter whether I have 100 % Zoom or any other. Sometimes it works sometimes not. Sometimes if I refresh browser page with Gantt Chart (immediately or after 2 Minutes) the refresh will make the change disappear, chart bar steps back to old start and end date. Reproducibility 10 % or so.
Hi Rainer,
e) I can confirm that too, but this is not too hard to deal with.
d) These show that the width and height of the grid do not match the columns/days (width) and the number of tasks/rows, while the position and size of the tasks seem correct
c) The 27 is the last day/date of the ruler, but does not fit in the top right corner and is wrapped into another invalid line. So in fact this is the same effect as the second screenshot where multiple days/dates are wrapped.
a/b) I think you need enough (number) and long enough tasks (time) to produce these effect but you will see the messed up colors (weekend and current day) anyway.
I think these are all effects of rounding errors that cause individual cells to take up too much space or not enough space. This usually happens due to unsuitable border, font size, line height, and overflow settings, but I can’t find the problem, or rather, the entire grid calculation seems questionable to me.
Hi there,
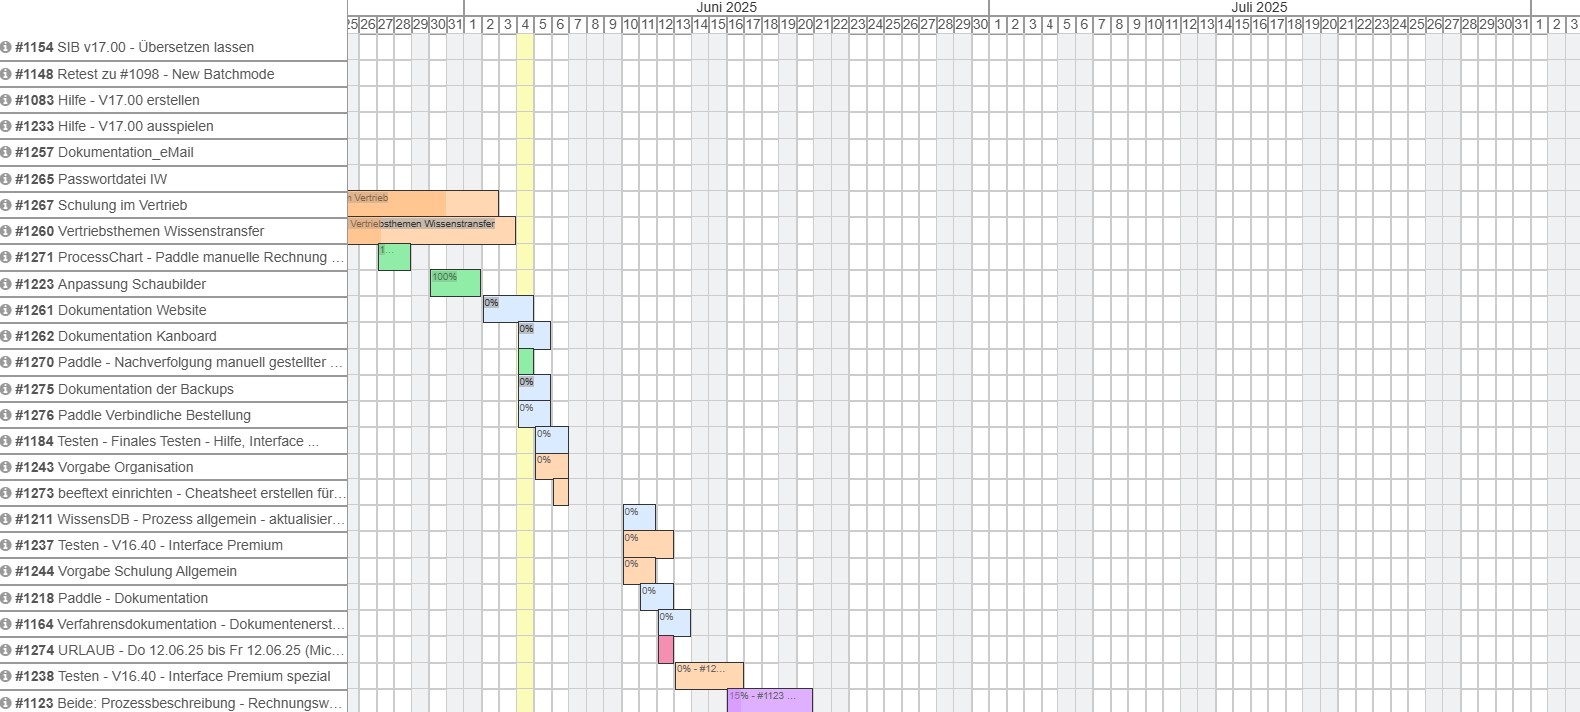
ok, I made a bunch of changes to outlines, sizes, padding, etc and now it seems to work fine under High-DPI resp. when zoomin in and out. The style of the chart changed a little but it is now usable with 4K monitors and e.g. zoom 175%
Here a screenshot with 50% Zoom. I also added a little feature to add a variable to store the dates of holidays or a year so that they are colored in the color of the weekends